Meet the System – Production Reporting

Industrial Plants Area
Production Reporting with Production Plan Analytics and Performance Supervision
Description
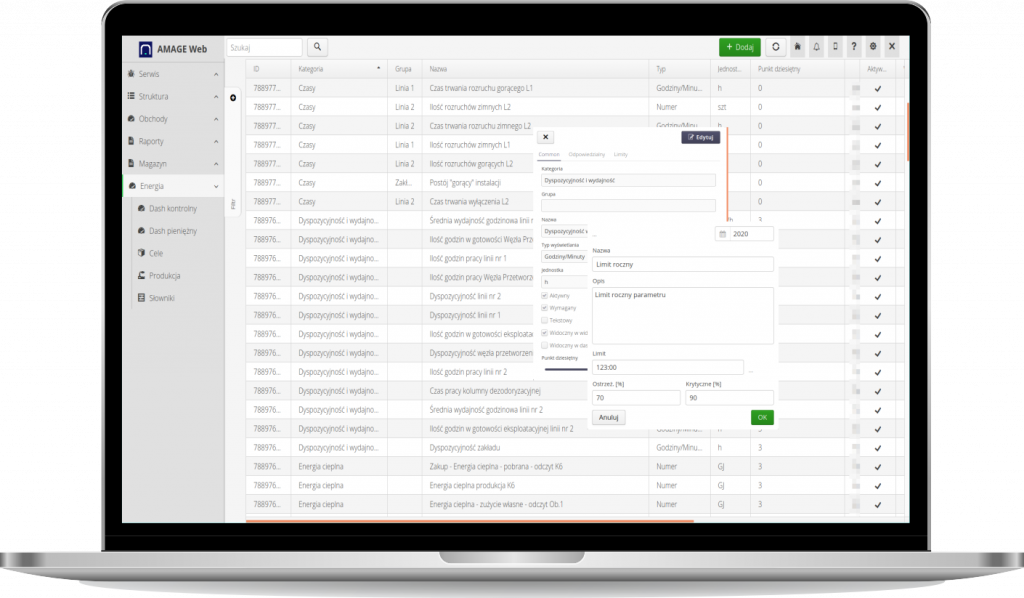
The solution allows full reporting and monitoring of the plant’s production area. Any parameters of the production process can be reported. The system is flexible and allows adaptation to any area. It is the best solution for plants with industrial production with a continuous process in which parameters change over time and need constant monitoring. The area coordinator in the first stage defines a list of production parameters by areas and groups. That makes it possible to monitor, for example, the number of input materials for a production process divided into two production lines. Each parameter can define the method of reporting, the people responsible for its reporting, the type (number, number of events), and time limits. Time limits allow you to specify the maximum amount of reporting of a parameter in a given time (day, week, month, year). Each limit has its own notification levels (warning, alarm) used when monitoring the system.
After defining such parameters, the system starts the mechanisms for the employees to report the parameters on a daily, monthly, or event basis (when they occur). The system indicates what information should be entered into the system. In case of delays in data entry, the system reminds the employees through notifications or emails about these activities. Those responsible for coordinating these areas can monitor the completeness of the entered data and implement corrective actions.
The system has the ability to automate data retrieval from external information systems (or other AMAGE functions), such as information from the electricity meter system, environmental measurement systems, weighing systems, etc. That allows to automate operations, but the user can independently make data corrections at the level of bilateral arrangements (e.g., between the plant and the energy supplier).
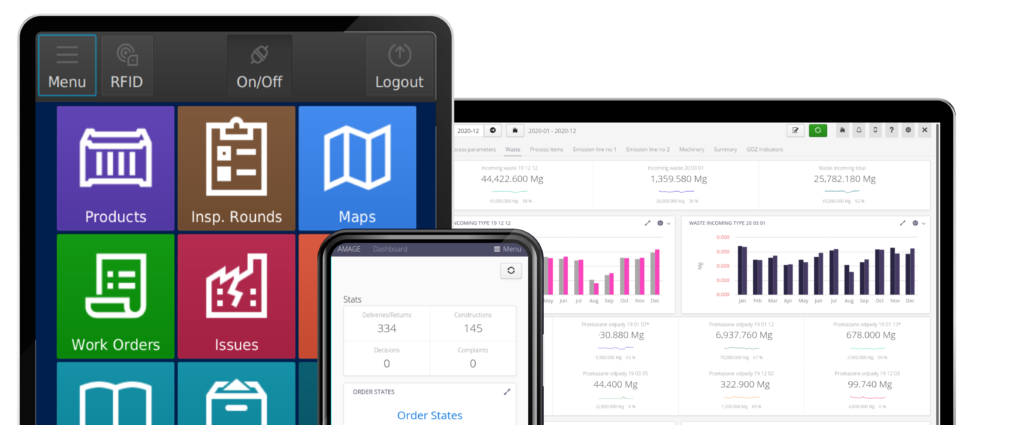
The entered data is analyzed for exceedances of defined limits and can generate alerts to detect problems with specific production values in advance. The system can generate daily reports based on the entered data when a complete set of information is received. A separate area in this solution is the ability to define production plans that take into account advanced expressions based on fixed data or derived from reported production parameters. In this case, the system allows you to monitor the performance of actual production data against the plan and calculated comparison factors. All these data: production and plan parameters can be visualized through graphic panels (dashboards) by user-designed components. That allows to easily present all production data and execution processes related to the plant’s annual plan and provides control over the realized process, usually scattered among multiple spreadsheets.
Advantages for the System Users
- Definition of production parameters. All parameters are in one place.
- Reporting of production parameters by responsible employees.
- Ability to review data, block months or force corrections in entered data.
- Ability to integrate external systems (measurements of environmental parameters, energy, chemical probes, weighing systems).
- Visualization of parameters through charts, multi-charts, and dashboards, receiving all data given in an easy-to-analyze manner.
- Automation of limit monitoring and reporting execution through notifications, email alerts, and in-app notifications.
- Daily/monthly reports are automatically generated after receiving all data from multiple people responsible for their areas.
- Ability to define production plans taking into account advanced mathematical rules linking plan parameters to each other and production data. Visualization of the completion of plans with the approximation of data during the year.
- List of parameters required for reporting. Reminders when a report is required.

Value of Investment and Savings
- The costs of managing all information manually by multiple people and storing this information in many separate systems or spreadsheets.
- The costs of critical parameter overruns not being detected through appropriate production limit conditions.
- The costs of accessing historical data and compiling data manually for senior management.
- The costs of not being able to perform quick analyses of the execution of the production plan against the reported data, not being able to perform these measurements in a meaningful time frame.
- The costs of manually integrating data from multiple measurement/IT systems and aggregating data manually using spreadsheets.

Users
- Area coordinators – define production data, define those responsible, monitor data input, and create dashboards and visualizations based on which they monitor the execution progress. They receive notifications from the operation of the process and exceedances of limits for production parameters.
- Senior management – defines the production plan and monitors its execution based on data from production parameters, obtains insight into production data, and processes information through easy-to-analyze dashboard views (charts, tables, indicators).
- Employees – report production data, correct data, and have insight into the necessary results of individual areas for their work.
Components:
- AMAGE Web application