Meet the System – Energy Meters, Billings, and Energy Market

Industrial Plants Area
Energy Meters, Billings, and Energy Market – Energy Balance Management
Description
The solution allows aggregation of data from electricity meters, their visualization in accordance with the customer’s requirements, and based on the measurements, generation of synthetic information necessary for billing and formal reports such as ARE G.10/ G.10m. The solution consists of local data aggregators from metering devices. Metering data is collected via serial buses plugged directly into electricity meters via IEC -62056-21 and DLMS protocols.
Data on all key parameters (capacities, meter values, operating parameters and critical events, and others) are retrieved by dedicated data aggregators located in the most suitable locations for the location of meters and data buses. These data in the aggregators are processed and sent to a central data synchronization server.
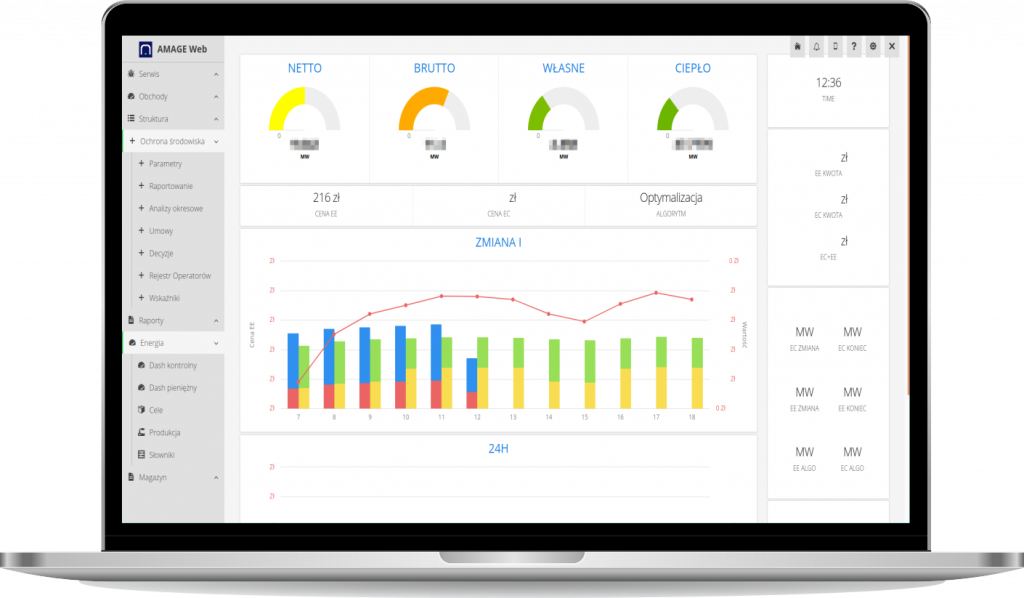
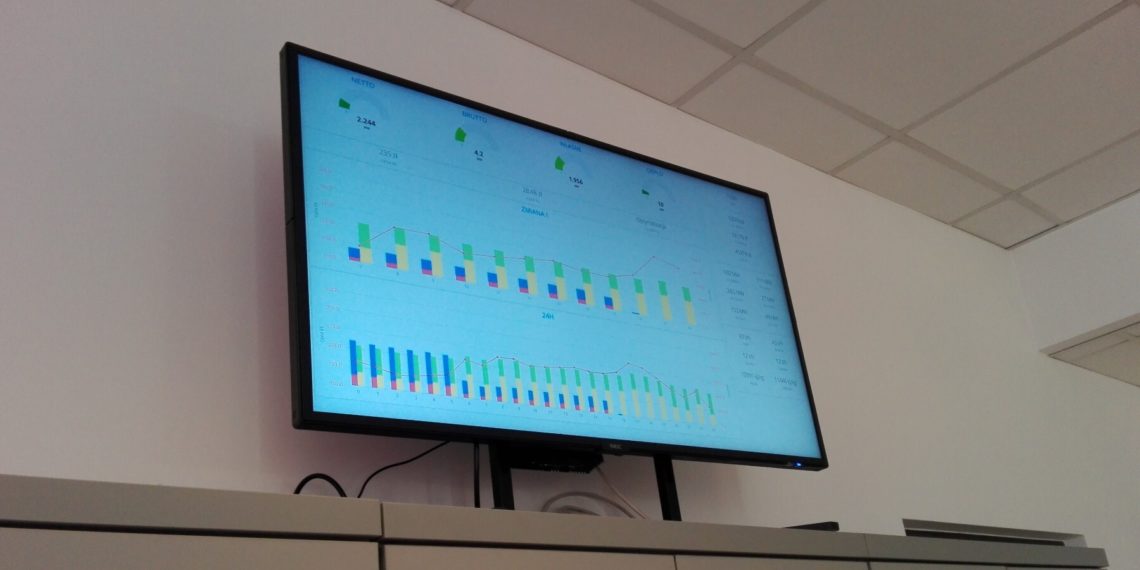
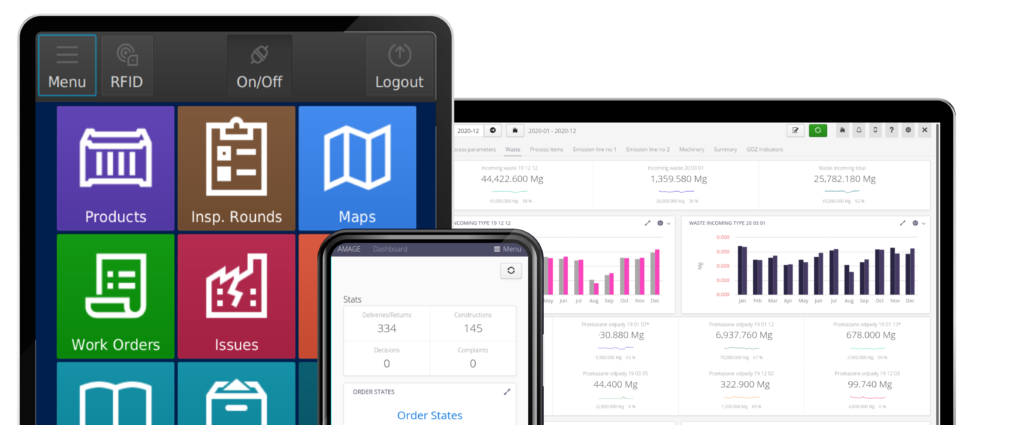
When there is no network connection, the aggregators locally store data and send it to the central server when the communication link returns. The central server stores the data and makes it available through a browser interface for area coordinators. Data can be presented in the form of measurement tables, analytical charts, and graphical tables (dashboards).
The system also allows you to define automation of actions based on collected data – instantaneous power overruns, power generation outages, and other events can be linked to email notifications or within the application. Extensive visualization mechanisms via dashboards allow visualization of complex expressions combining multiple measurements and variables.
All energy data is useful both for verification of energy consumption sources but also for automatic generation of synthetic reports to external reporting entities such as ARE and G10/G10.m reports. In the case of the company’s energy sales, the solution, through integration with market prices from the sources of the Polish Power Exchange (Day-Ahead Market) as well as from the Polish Power Grid (Balancing Market), allows visualization and calculation of the value of energy delivered to the grid. The system can also include additional mark-ups introduced through cooperation with energy brokers as an intermediary element in sales to energy markets. All visualized data through dashboards and calculation reports considers declared/actual amounts of energy supplied to the grid.
Advantages for the Area Coordinator
- Full knowledge of energy consumption at individual plant control points.
- Operational information from equipment – all measurement data, alerts, and definitions of control events.
- Automated notifications of events exceeding taken parameters of energy consumption/generation.
- Data visualization using dashboards and charts with the ability to combine variables into complex expressions.
- Automation in the area of formal reporting to external reporting entities.

Value of Investment and Savings
- The costs of exceeding the parameters agreed with the energy supplier.
- The costs of not optimizing energy consumption at the plant due to insufficient knowledge of consumption sources.
- Lack of information on the balance of energy consumed/supplied – for plants with internal energy generators (thermal, solar, wind, etc.).
- The cost of manual preparation of analytical reports for external reporting units.

Users
- Area coordinator – defines energy measurement points and expected measurement data. Metering data analysis. Generation of reports and analysis to external reporting units.
Components
- AMAGE Web application
- Measurement data aggregators
- Data sync servers